Ibuprofen content in pills
Brewing the own beer is a quite ruminant process for a craft brewer. Beside taste, smell and colour a craft brewer also wants to know the beer’s alcohol content. While traditionally the brewer measures the alcohol with an areometer, in industrial processes near infrared spectroscopy is the state of the art.
For homogeneous substances usually single point spectrometers are used. For heterogeneous materials those instruments don’t work well in particular if a spatially resolved information is needed too. To get spatially resolved, spectral information, so called hyperspectral cameras were introduced. But hyperspectral cameras produce an enormous data load.
With its Perception STUDIO and Perception CORE, Perception Park provides tools that enables engineers to integrate hyperspectral cameras quickly and to develop hyperspectral applications with a very short time to market.
Beside qualitative applications the Perception STUDIO also enables quantitative measurements. Inline quantitative measurements may support many processes like rating the caloric value in recycling processes. But also in food processing a quantitative information can save a lot of money when e.g. assessing moisture, starch and sugar content of raw fries and controlling the temperature of the fryer afterwards.
But the supreme discipline is the 100% quality control of pharmaceuticals. In the present show-case we explain the quantitative measurement of an active pharmaceutical ingredient (API), here Ibuprofen.
Sample preparation:
Ibuprofen 600 without coating mixed with lactose and pressed to tablets.
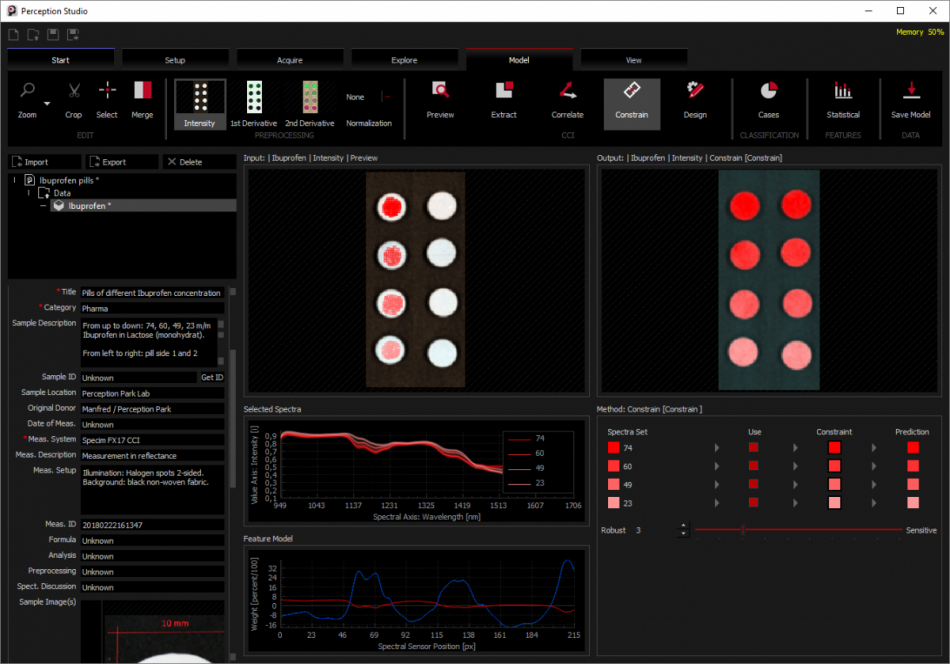
Both sides of the pills were recorded with a Specim FX17 hyperspectral camera. Side 1 was used for training, side 2 was used for validation. In the present case the Chemical Colour Imaging method “CONSTRAIN” was applied in the Perception STUDIO.
The pills with different concentrations of Ibuprofen were selected (red spots in the left image) and a “Constrain”-model was generated. In the right image the concentration of the Ibuprofen is illustrated by a grey value. By this every vision system can be used to classify the concentration or even set a threshold. By using the Perception CORE this can also be applied for inline processes at highest speeds.
Validation:
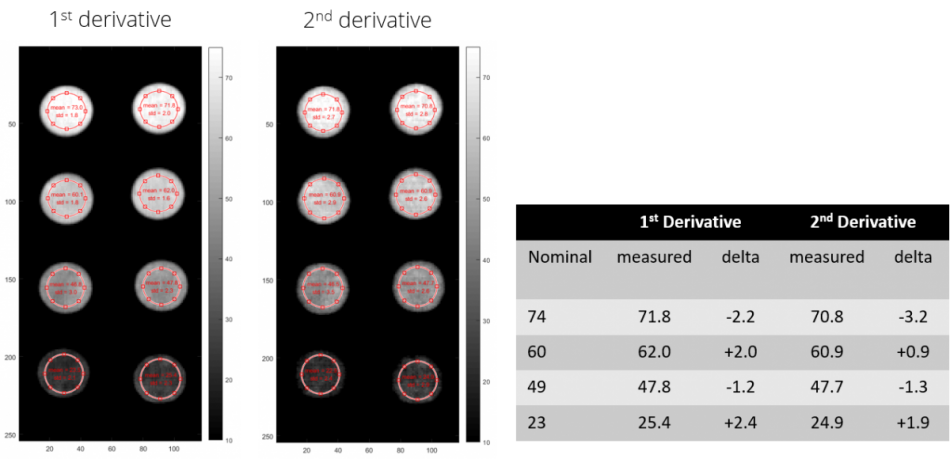
Due that the model was generated by reference spectra of side one of the pills, the backside of the pills can be used for validation. In the right image above the grey value of the right column of the pills is almost the same as the left column. The images for different pre-processing were analysed statistically using MATLAB.
Measurements using 1st derivative and measurements using 2nd derivative are comparable. Since the value of the noise is larger when using the 2nd derivative (standard deviation is more in value), for an industrial application the 1st derivative might be the preferred pre-processing method.
Modeling more than one substance:
For some industrial inline processes it is important to measure several quantities in parallel. Therefore the Perception STUDIO provides several possibilities to do this. One is to stream several monochrome streams in parallel, each describing the quantity of an ingredient.
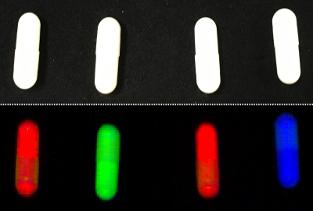
Another possibility is to model an RGB stream where each colour represents the quantity of a substance. This is usually applied when different substances influence each other and when the relation of different substances are needed. For example, it would be possible to describe a potato by its content of starch, sugar and moisture. If those substances are modelled on the RGB channels machine vision systems can monitor if the relation in the fruit is disturbed or not.
Using third party tools for modelling:
For some tricky applications, experts of spectroscopy and chemometrics develop specialised models.
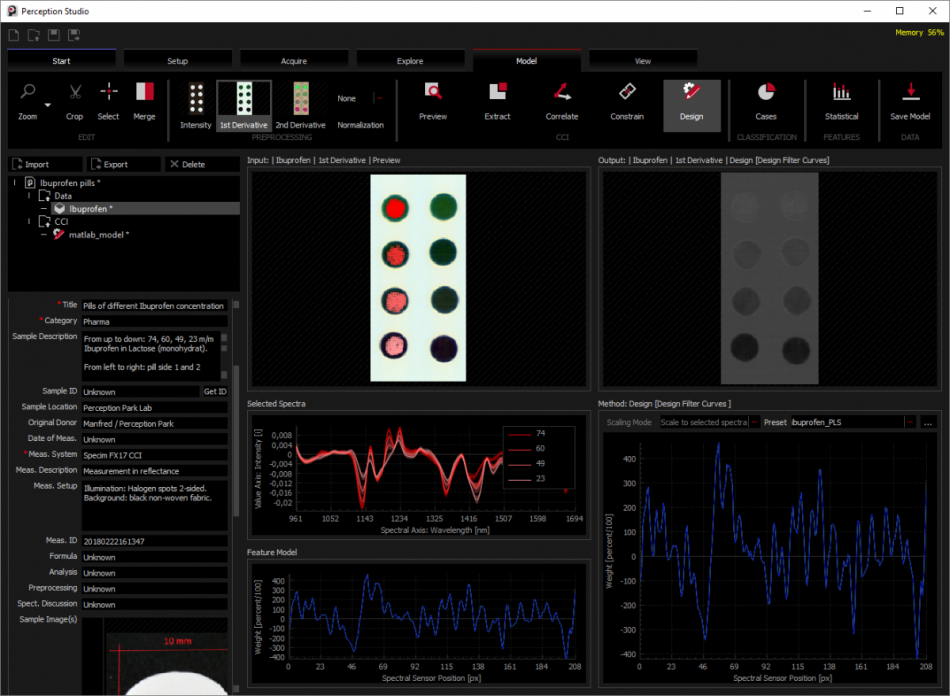
The Perception STUDIO enables to import these models and to compile them for our inline engine Perception CORE. In the example above we designed a chemometric model by using MATLAB and imported this model into the Perception STUDIO.
For the present example we provide a tutorial in our Perception Wiki knowledge data base. Here you find also some deeper information on how to import models from 3rd party software tools.
Tutorial: Quantitative Analysis of Ibuprofen Pills


